Setting up the software for the project – Developing IoT Solutions for Digital Transformation within Industry 4.0
By Patrice Duren / June 1, 2022 / No Comments / AWS Certification Exam, Case study of Amazon, Working with partners on IIoT
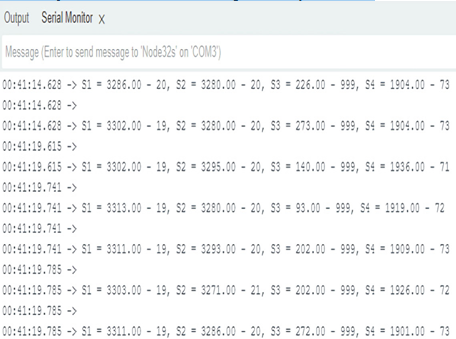
After finishing writing the sketch, compile and download the code to the ESP32 by clicking on the button on the Arduino IDE. Open the Serial Monitor to see the console where you can monitor the printed result. You will see something like this on your console:

Figure 13.23 – Sample output from Serial Monitor
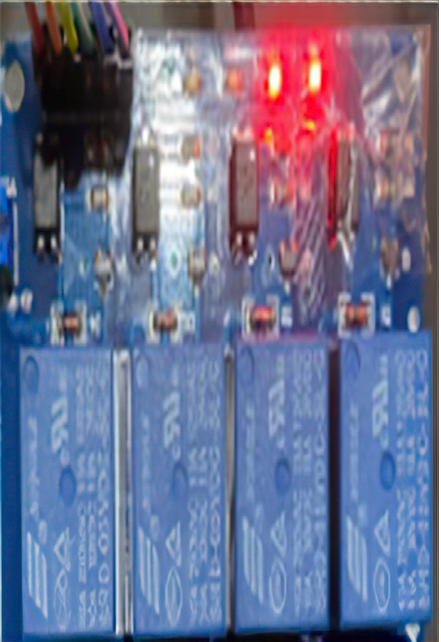
Each sensor will display two values: the raw analog read value and the mapped value (between 0 and 99). If a sensor is not present, the analog read will provide quite a small value (<800), which will be assigned a value of 999 to easily identify as no sensor is present or the sensor is broken. In the preceding result, we only connect three moisture sensors (S1, S2, and S3), of which sensor S3 is not attached. We can see that the S3 raw value is quite small and translated to 999, which means no sensor is attached or the sensor is damaged. Sensors S1 and S2 are left dry, while sensor S4 is covered with a damp cloth. We can see that the raw values of S1 and S2 are very high (>3,000) and the mapped moisture values are low, that is, near 20%, which is below the low trigger level, so the S1 and S2 relays should be switched on. This will trigger the solenoid water valve; the water pump will turn on and the water will flow to the destination plant pots. The raw value of sensor S4 is low (around 1,900), and the mapped value is high (more than 70%). Since this value is higher than the high trigger level (65%), the appropriate relay for S4 should be switched off. This condition can be seen in the LED representation on the four-port relay module, where only IN1 and IN2 are turned on, while IN3 and IN4 both are turned off.

Figure 13.24 – LED status of the four-port relay module
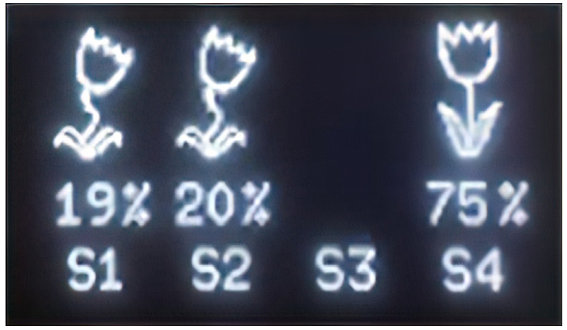
The OLED display will show something like this:

Figure 13.25 – OLED display sample of the four sensors
As the mapped values of sensors S1 and S2 are considered dry, the bitmap picture will display a bad plant picture, while for sensor S4, since the moisture level is high, it will display a good plant picture. Since sensor S3 is not present or is malfunctioning, no picture and no value will be displayed.
And that’s it; you’ve made your smart garden system!
By undertaking this exercise, you have acquired the knowledge and skills to design and implement a smart garden system. You have learned the importance of various sensors, as well as actuators such as submersible water pumps and relay modules, in maintaining optimal plant growth conditions.
Furthermore, this practical exercise has helped you to develop your programming skills, enabling you to implement custom logic for analyzing sensor data and controlling the relay module according to the plant’s needs. Optionally, you will have had the opportunity to learn how to store sensor data in a database and create a web-based dashboard for real-time data visualization and system monitoring. The hands-on experience with open source IoT tools and platforms has given you a foundation for understanding the potential of IoT technologies, promoting innovation and practical applications in various fields.